Before the platform it was photos on WhatsApp, scattered timeline spreadsheets and random emails. Today each client logs into their own portal and sees daily reports, photos and timeline updated in real time. It professionalized my delivery in a way I'd never reach on my own.
Built to impress.
Engineered to deliver.
Systems, dashboards and tech solutions for businesses that want visibility — from your business and data to the market.
Tech that understands business.
I'm Kaio. At Data Fortis, I bring together three rarely-combined areas: development, BI and controllership. The result: tech that moves your business.
It's not just about writing code — it's about building tools that make a real difference in the client's business.
Moves your business.
Founder
Kaio Alves
Combines development, BI and controllership in a single purpose — to understand both code and business.
Areas
- 01Web DevelopmentNext.js · React · Node
- 02Business IntelligencePower BI · Python · SQL
- 03ControllershipP&L · Cash Flow · Budget
Three fronts. One purpose.
Technology, data and strategy. In the same project.
Projects that speak for themselves
Each client, a solution.
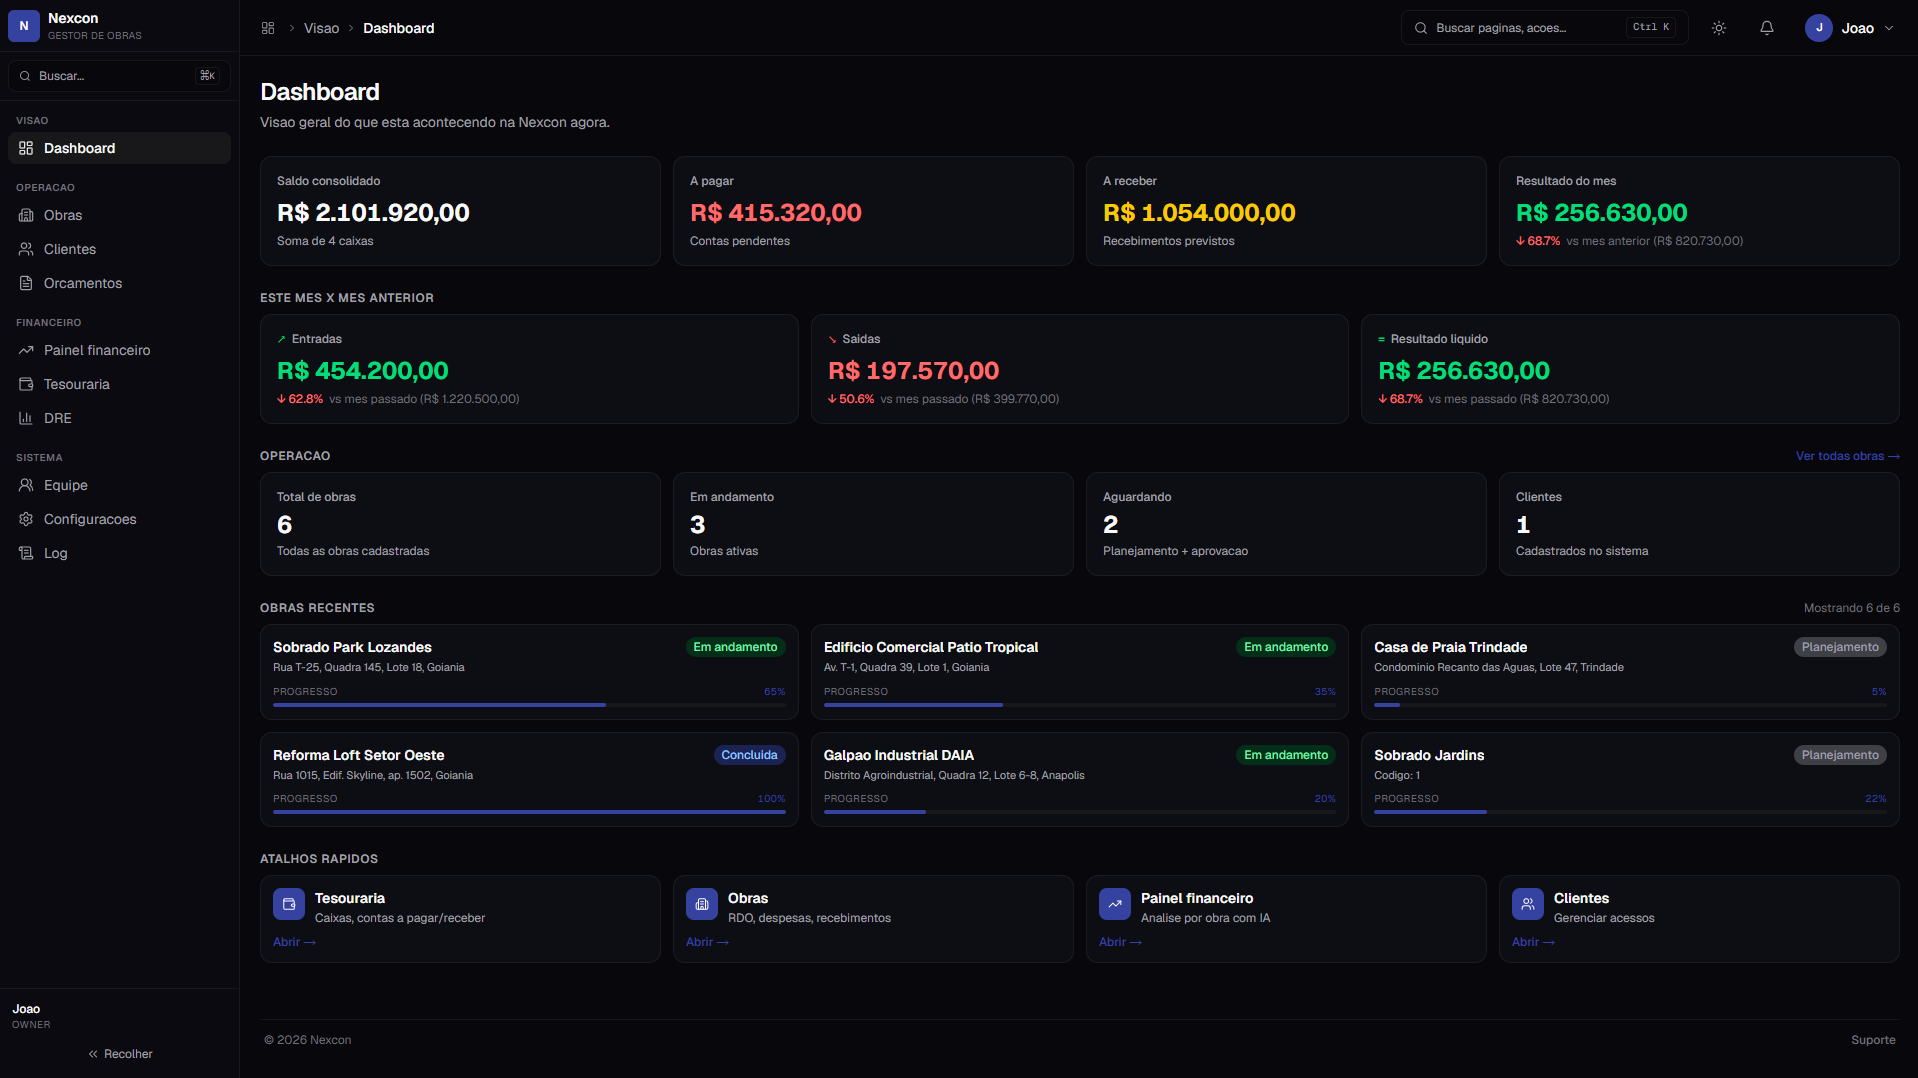
Construction Manager
Construction management platform for builders and architects: daily reports, financials, measurements, timeline and AI analysis in a single system, paired with a dedicated portal where each client tracks their project's progress in real time.
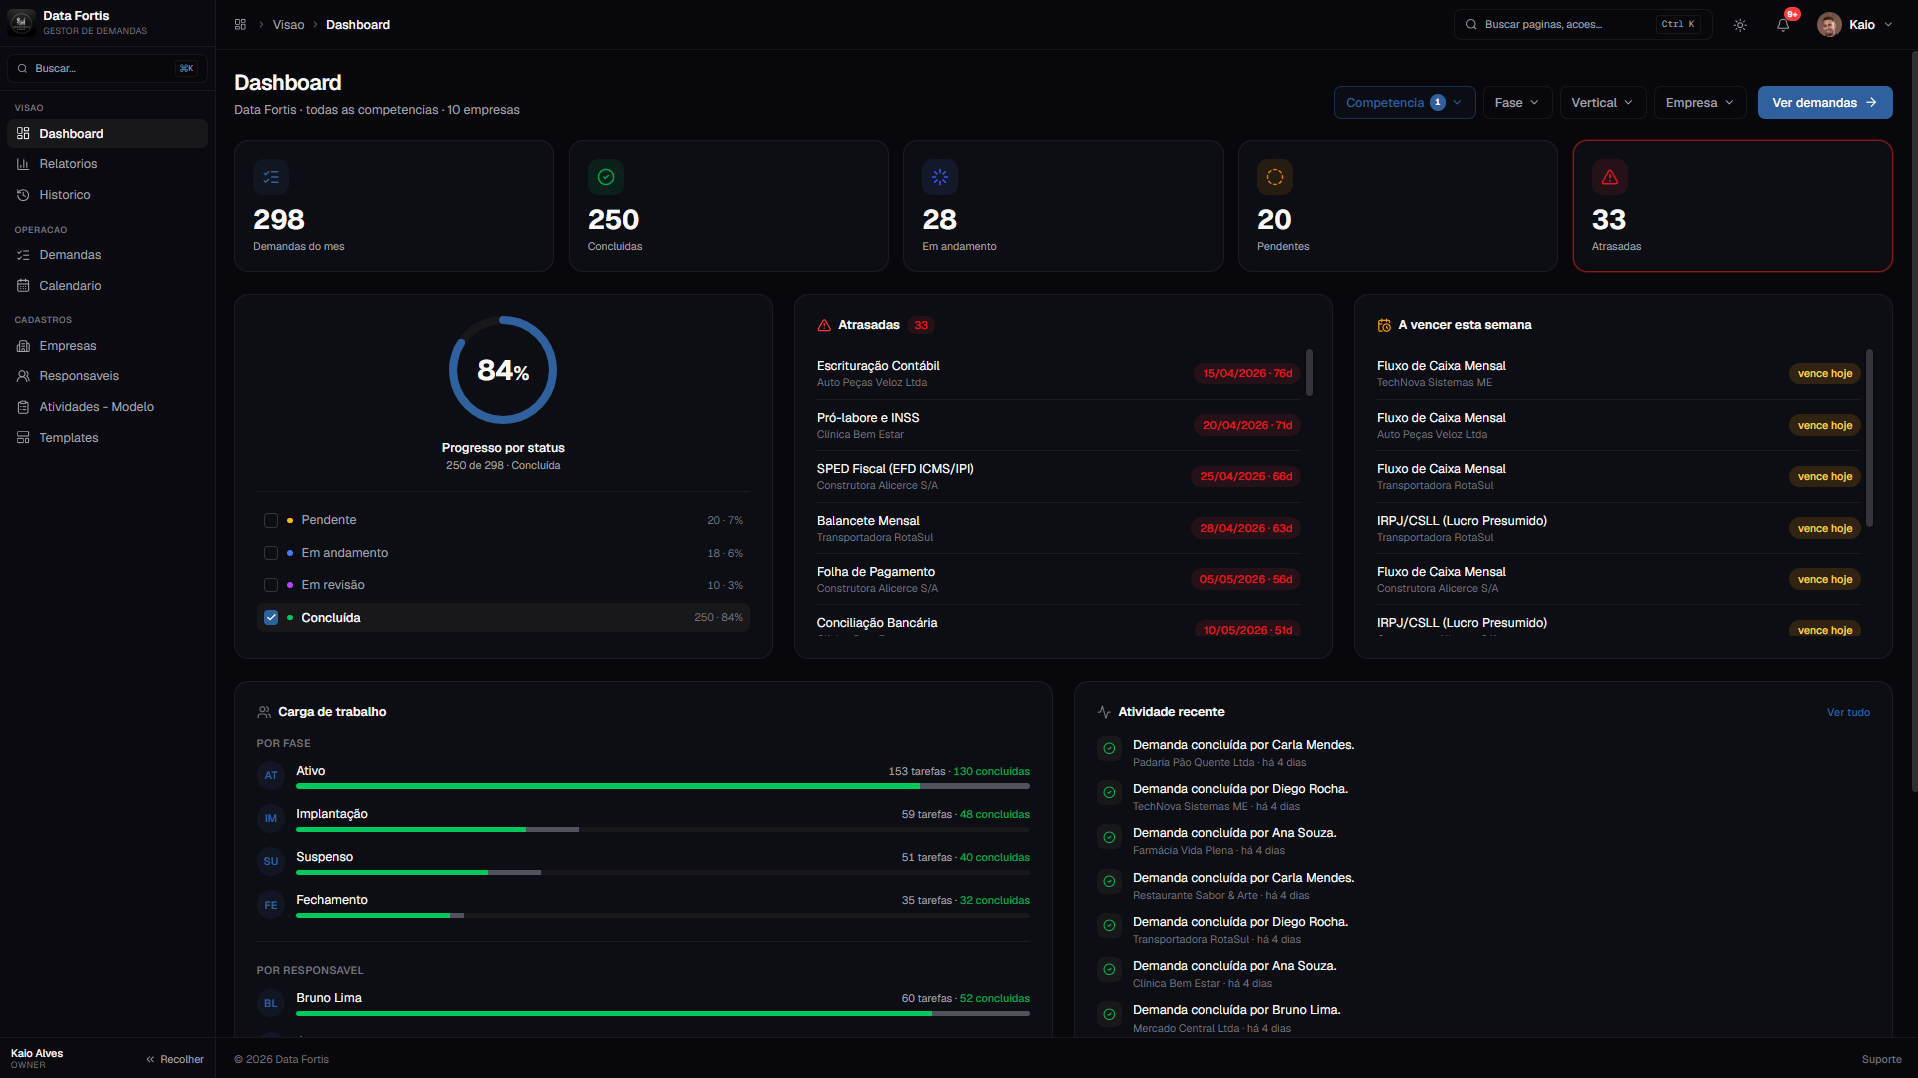
Workflow Manager
Platform for firms and teams handling recurring obligations: each task by reference month, with legal and final deadlines, kanban, due-date calendar, reusable activity templates and productivity reports — all in one place.
What clients say about my work.
Measurements, expenses and timeline now talk to each other. What won me over was the AI analysis flagging where margins are tightening before we'd ever spot it in Excel. Reporting time dropped from hours to minutes.
I had reports coming from every direction and yet it still felt like I was driving in the dark. Kaio sat with me, organized P&L, cash flow and indicators into a structure that makes sense to whoever's deciding. Today I know where I make money and where it slips away.
Helpful content.
Thoughts on tech, data and management.
Why a beautiful dashboard doesn't mean a better decision
Most corporate dashboards are aesthetics without method. I show the difference between a report that impresses and an indicator that changes decisions — with 3 practical signals to evaluate your BI.
We built a multi-tenant SaaS in 12 weeks — what we learned
From zero to deploy: architecture, database, authentication and UX in a construction SaaS. The 5 mistakes we avoided and the 3 choices that accelerated delivery — with real code.
A P&L executives actually read: 5 adjustments that matter
Technical financial statements do not reach the board. I adapt P&L for executive reading: visual structure, margin hierarchy and metrics that answer what the partner really wants to know.
Stay updated.
Subscribe to receive content about tech, BI and management directly in your inbox.
Let's build
yours.
Next Step
Tell me about your project. The first chat is on me.
- ●24h response
- ●No commitment
- ●Free quote